Proven Performance
Consistent Results Over Time

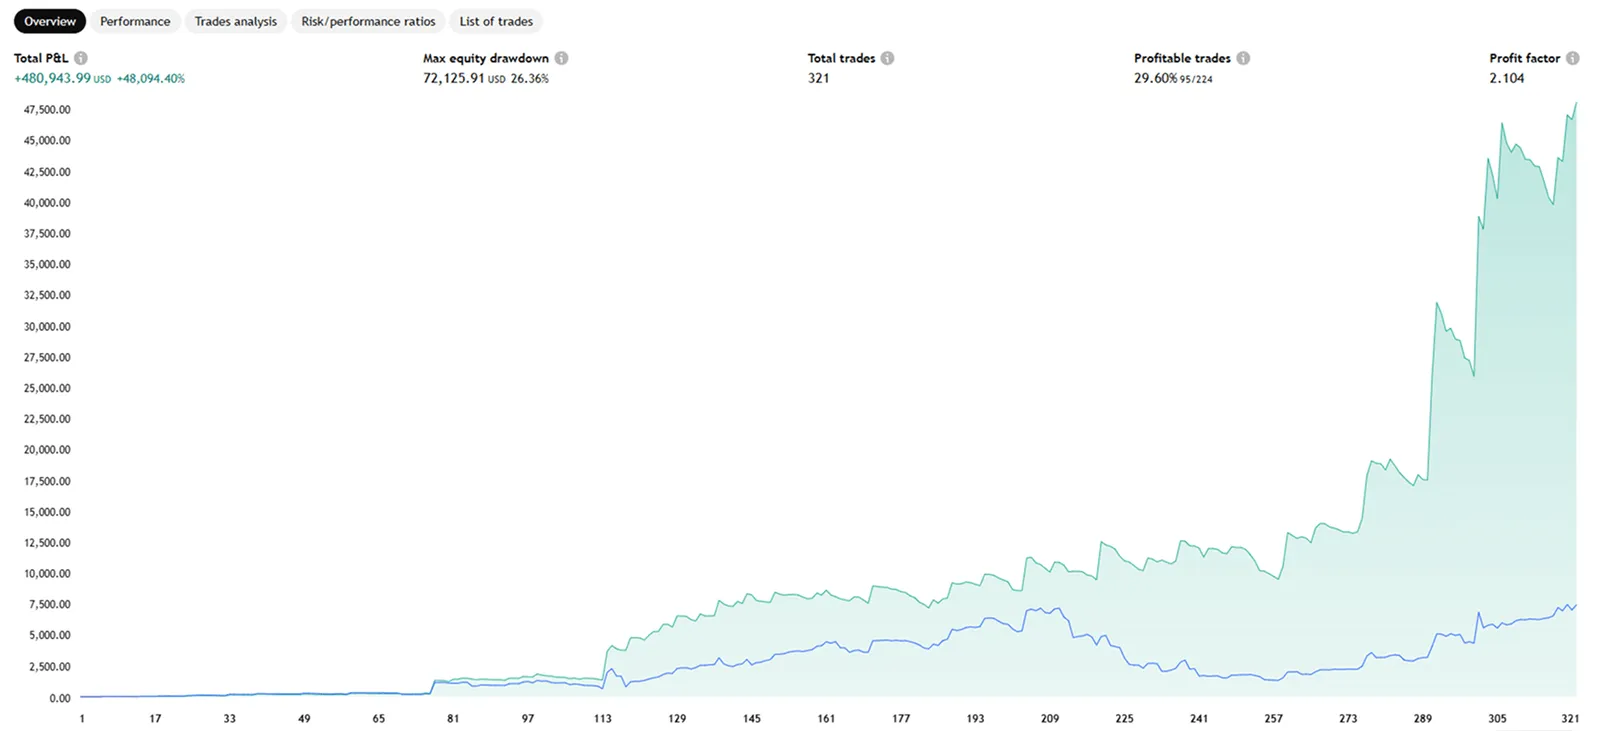
The strategy has proven itself most impressively with TQQQ. Over the full test period(about 12 years), the strategy achieved an amazing total return of 48,152%. In simple terms, a $10,000 investment would have grown to about $4.8 million.

The average annual return stood at about 67%, far beyond what most strategies can consistently achieve. The strategy executed a total of 321 trades over 12 years, an average of about 27 trades per year (2-3 trades per month). This highlights its efficiency -exceptional returns with minimal trading activity.

No less important than the total return is the stable pattern of returns. The strategy was particularly successful in years when the market was volatile.

Comparison to Passive Holding

When comparing the strategy to the Buy and Hold approach with TQQQ, the differences are significant:

  • Total Return: 48,152% with the strategy, compared to 6,100% with Buy and Hold
  • Average Annual Return: About 67% with the strategy, compared to about 41% withBuy and Hold
  • Maximum Drawdown: 26% with the strategy, compared to 85% with Buy and Hold
Proven Performance TQQQ results
2013-2025 All 1Y 3Y 5Y Avg
AlgoZTrade 48,152% 85% 388% 1,036% 67%
Buy & hold 6,106% 47% 25% 160% 41%
AlgoZ Drawdown -26% -18% -26% -26%
B&H Drawdown -85% -37% -74% -85%
Proven Performance SPXL results
2013-2025 All 1Y 3Y 5Y Avg
AlgoZTrade Return 12,780% 69% 276% 785% 50%
Buy & hold return 2,195% 81% 74% 150% 30%
AlgoZTrade drawdown - 19% - 14% - 18% - 18%
Buy & hold drawdown - 75% - 24% - 59% - 70%
Proven Performance FNGU/FNGA/FNGB
2013-2025 All 1Y 3Y 5Y Avg
AlgoZTrade Return 17,382% 174% 1,130% 8,892% 109%
Buy & hold return 994% 185% 145% 662% 41%
AlgoZTrade drawdown -34% -14% -32% -34%
Buy & hold drawdown -92% -46% -86% -92%
Proven Performance UPRO results
2013-2025 All 1Y 3Y 5Y Avg
AlgoZTrade Return 13,226% 69% 279% 789% 50%
Buy & hold return 2,305% 81% 73% 149% 30%
AlgoZTrade drawdown -19% -14% -18% -18%
Buy & hold drawdown -75% -25% -59% -70%
Proven Performance QLD results
2013-2025 All 1Y 3Y 5Y Avg
AlgoZTrade Return 7,940% 57% 232% 502% 44%
Buy & hold return 3,132% 58% 82% 223% 34%
AlgoZTrade drawdown -19% -14% -18% -17%
Buy & hold drawdown -63% -26% -57% -63%
Proven Performance SSO results
2013-2025 All 1Y 3Y 5Y Avg
AlgoZTrade Return 3,134% 44% 159% 380% 34%
Buy & hold return 1,128% 57% 64% 142% 23%
AlgoZTrade drawdown -12% -9% -11% -12%
Buy & hold drawdown -57% -17% -43% -47%
Options for More Conservative Investors: QQQ Without Leverage &Hybrid Approach (50% TQQQ / 50% Bonds or Cash)

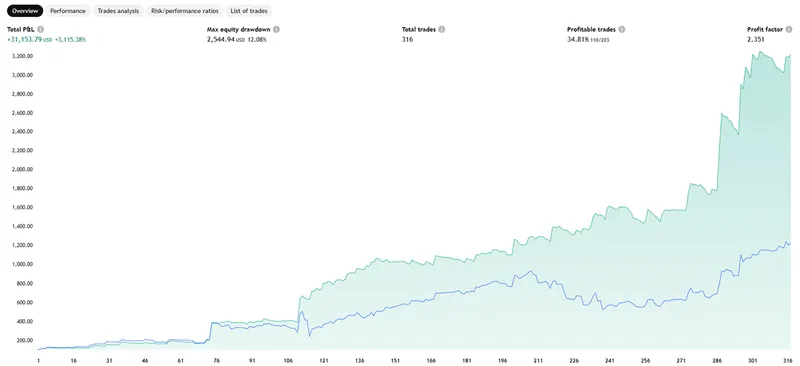
The strategy also works well on regular ETFs like QQQ or SPY. Using QQQ, the strategy achieved a total return of 725%, compared to 450% with the Buy & Hold approach, while maintaining a maximum drawdown of only 10-15%.

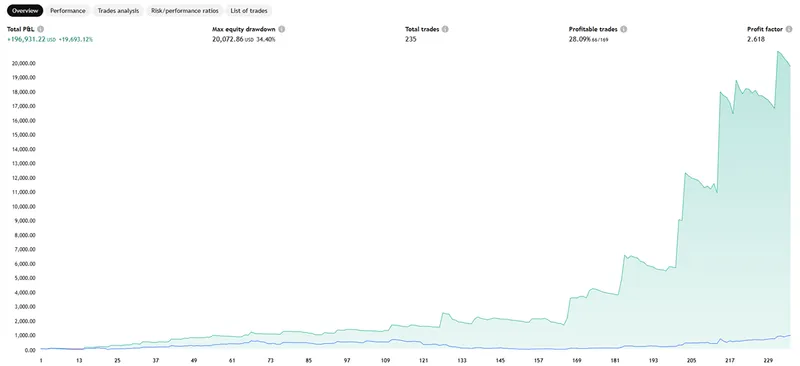
Additionally, for investors looking for a middle-ground solution between high-growth leveraged investing and a more stable portfolio, a 50% TQQQ / 50% Bonds or Cash allocation can provide a compelling alternative withTotal return of 3,745 % (35% yearly average) and Maximum drawdown of 14%

This hybrid approach offers a balance between risk and reward, reducing volatility while still outperforming traditional indices over time. It is particularly suited for investors who want exposure to leveraged ETFs but with reduced drawdowns.

Proven Performance 50% TQQQ 50% cash
2013-2025 All 1Y 3Y 5Y Avg
AlgoZTrade Return 3,745% 26% 140% 294% 35%
AlgoZTrade drawdown -14% -9% -13% -14%
Proven Performance SPY results
2013-2025 All 1Y 3Y 5Y Avg
AlgoZTrade Return 482% 24% 69% 131% 16%
Buy & hold return 313% 28% 36% 81% 13%
AlgoZTrade drawdown -6% -3% -8% -4%
Buy & hold drawdown -36% -8% -22% -36%
Proven Performance QQQ results
2013-2025 All 1Y 3Y 5Y Avg
AlgoZTrade Return 970% 27% 94% 171% 22%
Buy & hold return 699% 32% 50% 130% 18%
AlgoZTrade drawdown -7% -5% -6% -7%
Buy & hold drawdown -38% -14% -30% -35%
Performance in Leading Stocks

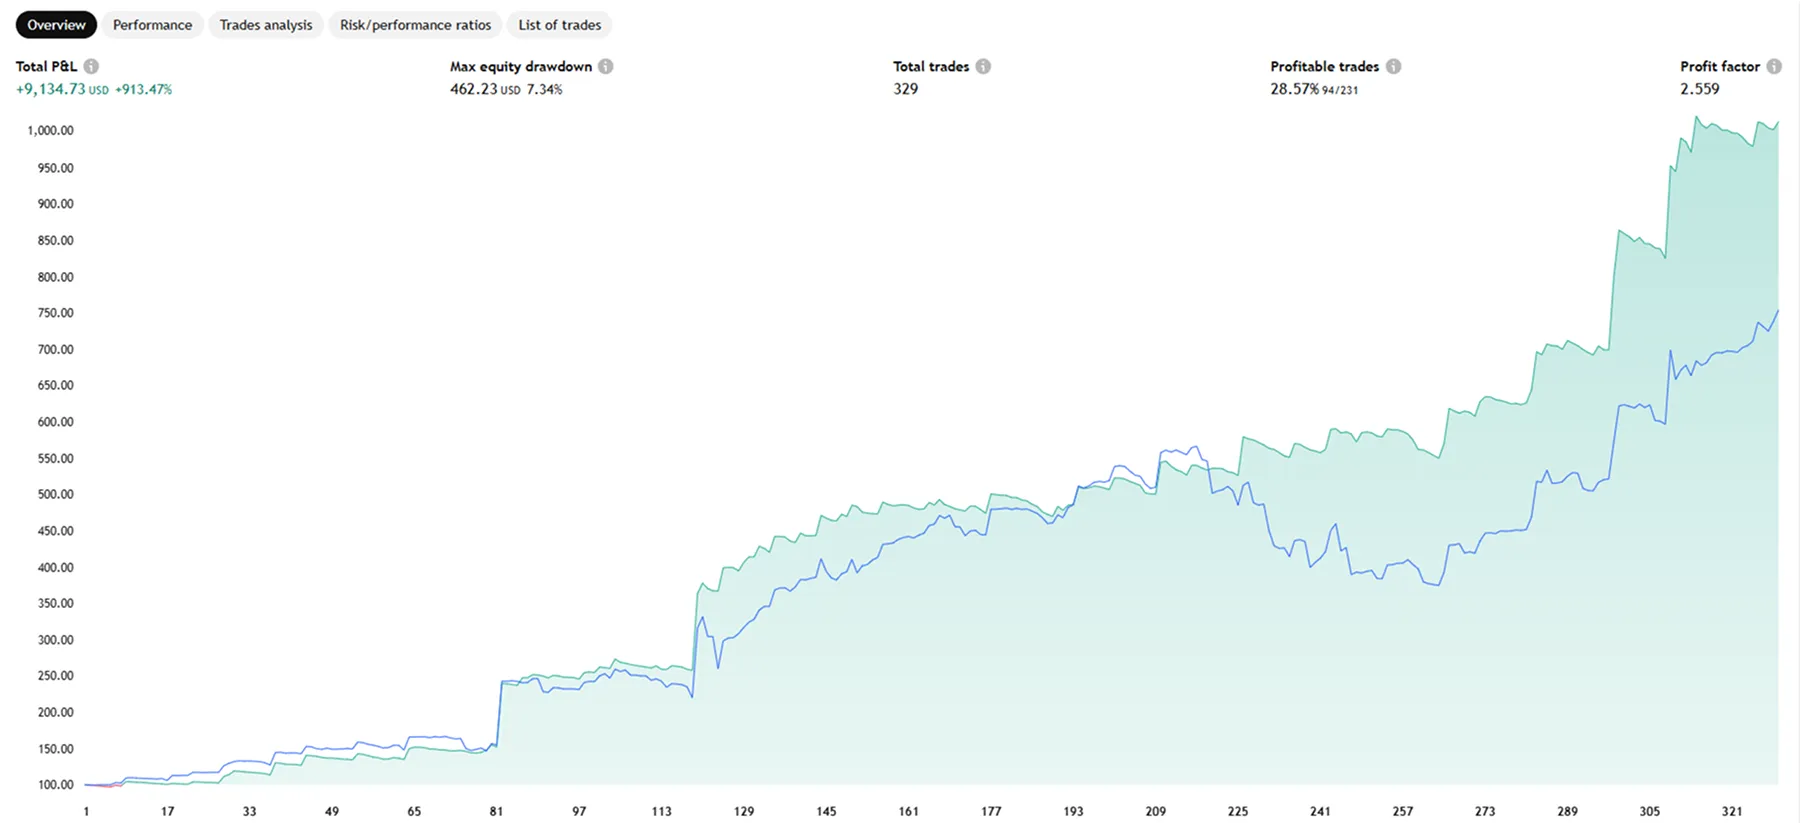
The strategy is effective not only on leveraged ETFs but also on leading individual stocks. It has demonstrated strong results on companies like NVIDIA, Tesla, Apple, andGoogle, achieving significantly higher returns with reduced drawdowns compared to passive holding.

Proven Performance AAPL results
2013-2025 All 1Y 3Y 5Y Avg
AlgoZTrade Return 3,258% 41% 145% 914% 34%
Buy & hold return 1,264% 39% 51% 384% 24%
AlgoZTrade drawdown -23% -8% -9% -9%
Buy & hold drawdown -36% -17% -31% -31%
Proven Performance NVDA results
2013-2025 All 1Y 3Y 5Y Avg
AlgoZTrade Return 80,117% 168% 704% 1,870% 74%
Buy & hold return 46,313% 151% 425% 1,762% 67%
AlgoZTrade drawdown -19% -18% -19% -19%
Buy & hold drawdown -66% -27% -66% -66%
Proven Performance TSLA results
2013-2025 All 1Y 3Y 5Y Avg
AlgoZTrade Return 137,048% 27% 469% 5,198% 83%
Buy & hold return 15,200% 58% 9% 469% 52%
AlgoZTrade drawdown -44% -15% -25% -44%
Buy & hold drawdown -73% -29% -57% -73%

Ready to Transform Your Trading?

Experience the power of algorithmic trading with AlgozTrade. Start your 30-day risk-free trial today.